Group Teaching using StoneRounds.org
What is Group Teaching Mode?
The group teaching paradigm allows one instructor to present cases to a set of students, each of whom is following along on their own device. Group teaching sessions encourage students to explore the clinical data in a self-guided fashion and allows students to individually work on developing full or partial diagnoses, while the instructor highlights important features to the group. This same framework allows the instructor to observe students’ diagnostic thought process in real time.
An important feature of StoneRound’s group teaching infrastructure is the ability to create a distributed classroom, in which all of the participants have access to the same data. For maximum benefit, the distributed classroom approach benefits from additional means of communication (e.g. a conference call, messaging a communication coordinator, etc.) as a medium for participants to seek clarification or request more information, and for the instructor to guide the participants from case to case.
The fundamental unit of teaching information is the teaching set – a set of cases presented to the “class” of students in an interactive fashion. Any user that is logged into StoneRounds can build and present a custom set of cases. That user can then share the URL or the ID of the teaching set to participants, who will be the students for this session.
In a traditional rounds-like Group Teaching session, each case is presented with a set of foundational information, typically consisting of retinal fundus imaging, fluorescein angiography, OCTs, and Goldmann visual fields, as available. The instructor can reveal specific additional information as the presentation continues. When ready, the instructor can allow students to “vote” on the most likely clinical diagnosis as well as proposing the gene in which mutations were found. The Group Teaching mode can also be used as an exam or board review session, in which the student group is already knowledgeable and are likely to develop a response quickly. The scoring and leaderboard features are great ways to make this more competitive and engaging.
How to Create a Teaching Set
As shown in the figure below, to create a new teaching set, a user must be logged in to StoneRounds. The process of constructing a new teaching set is started by clicking on their name in the upper right-hand corner of the screen to open their account menu, and then selecting the “Create Teaching Set” option within that menu.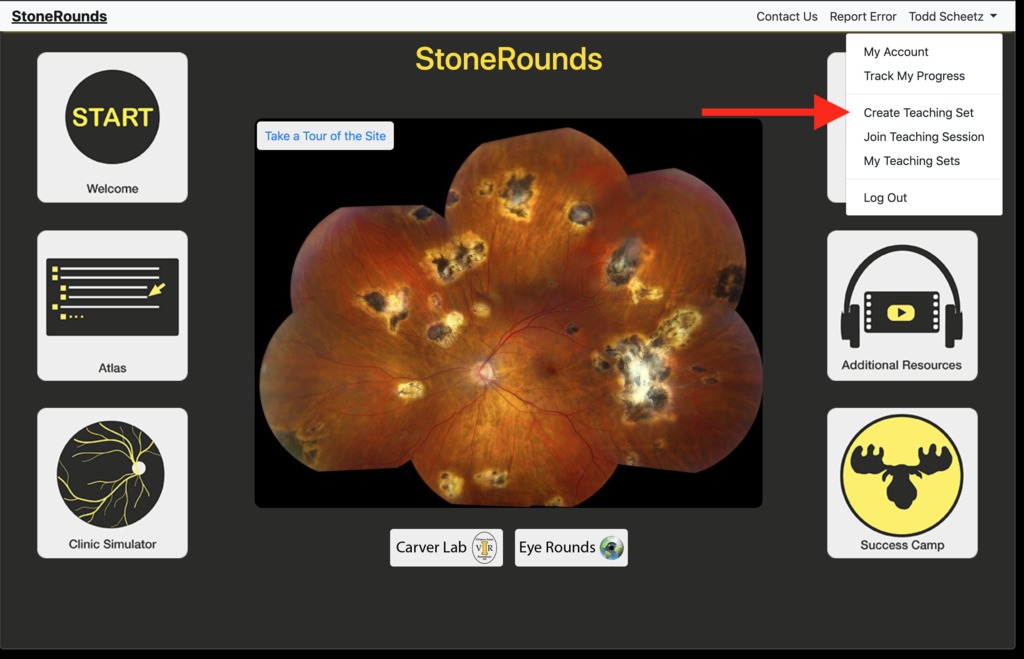
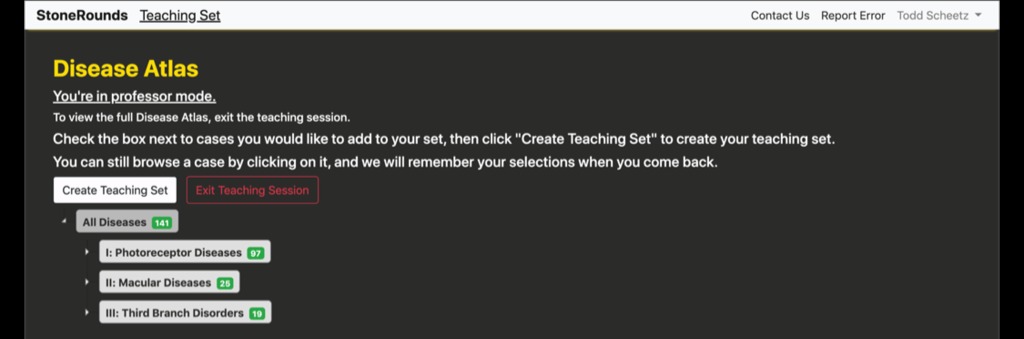
That will take them to a new page, in which they can select the cases they would like to include in the teaching set. As with the Atlas interface to StoneRounds, the cases are leaf-nodes on a diagnostic tree for which the first series of branches are “Photoreceptor Diseases”, “Macular Diseases”, and “Third Branch Disorders.”
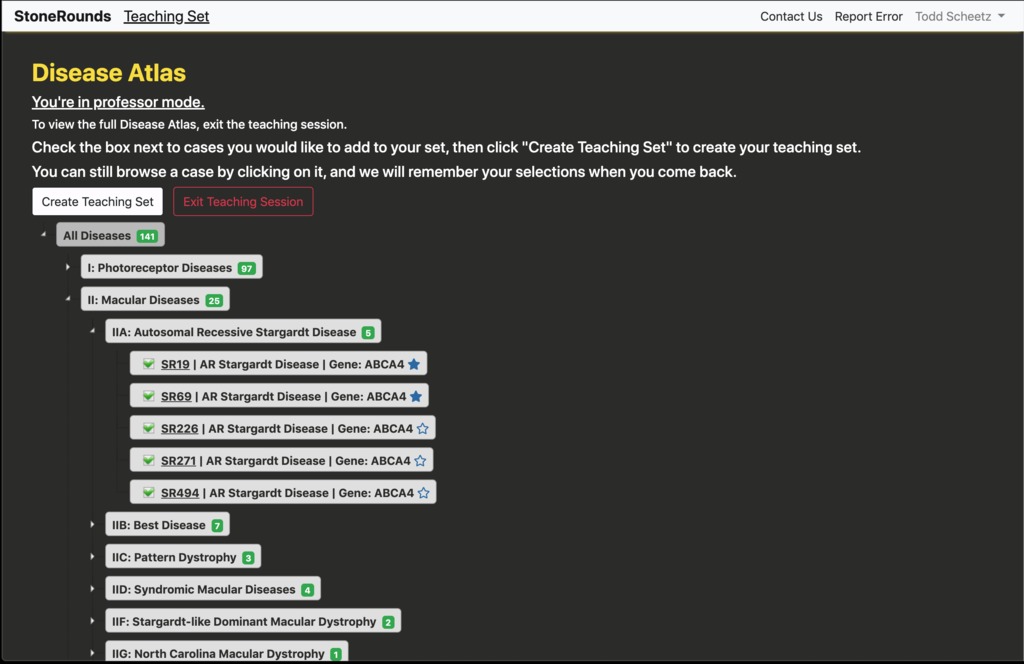
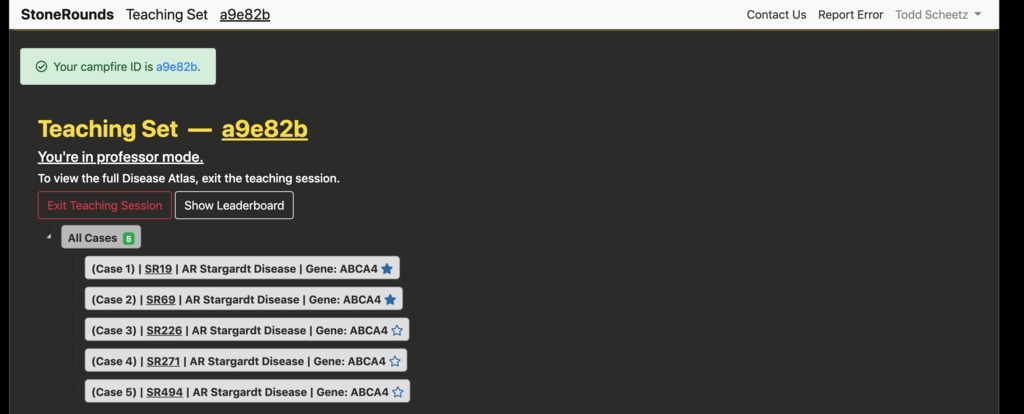
Each branch of the tree can be opened and explored independently, and cases within can be selected for inclusion in the teaching set. A user can build multiple different teaching sets in order to explore various inherited retinal diseases in detail. In the figure below, the user has navigated into the tree branch for Autosomal Recessive Stargardt Disease and has selected five cases for presentation. Cases can be selected for inclusion from anywhere in the tree, spanning any number of branches. For simplicity in this example, we’ve selected cases from a single branch. Once the user is satisfied with their collection of cases, they should press the “Create Teaching Set” button.
After pressing the “Create Teaching Set” button, the user will be presented with a page similar to the one below consisting of the cases they selected. The teaching set has now been created and is ready for use. The teaching set ID for this example is a six-digit hexadecimal, “a9e82b”. The instructor should share this identifier with those interested in participating the Group Teaching session. On this page, users can also modify the order of cases in their teaching set by dragging them into place and clicking the “Save Changes” button that appears. When another user views this list as a student, the cases will appear in the new order
If the user has already created teaching sets, they can view them by clicking “My Teaching Sets” in the account menu which will take them to a page like below. In addition to the identifier, each teaching set lists the cases that are included; buttons to rename, edit, and delete the set; and a button to use this teaching set as a template for a new set.
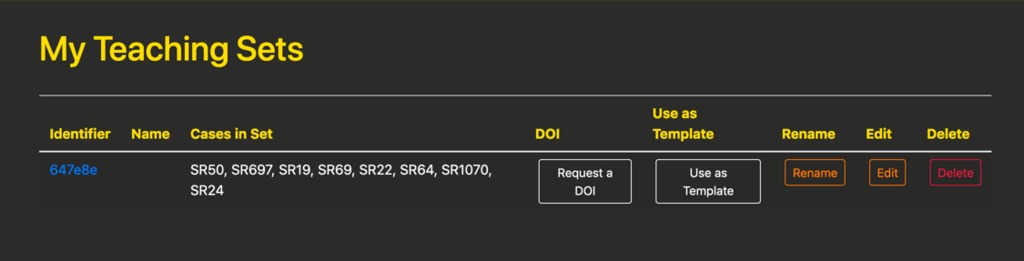
Using a set as a template opens the teaching set creation page with the cases in the current set selected automatically. This makes it easy for users to expand or refine a topic (e.g. macular diseases vs. autosomal dominant macular diseases) into a new set.
Presenting Cases
There are two primary ways for students to join a Group Teaching session. The first is for the instructor to share the full URL directly. These are of the format https://stonerounds.org/teaching/a9e82b, where the last portion is the teaching set identifier. Alternatively, a user on the site can use the “Join Teaching Session” menu option within their account menu (located in the upper right-hand corner), and enter the teaching set identifier.
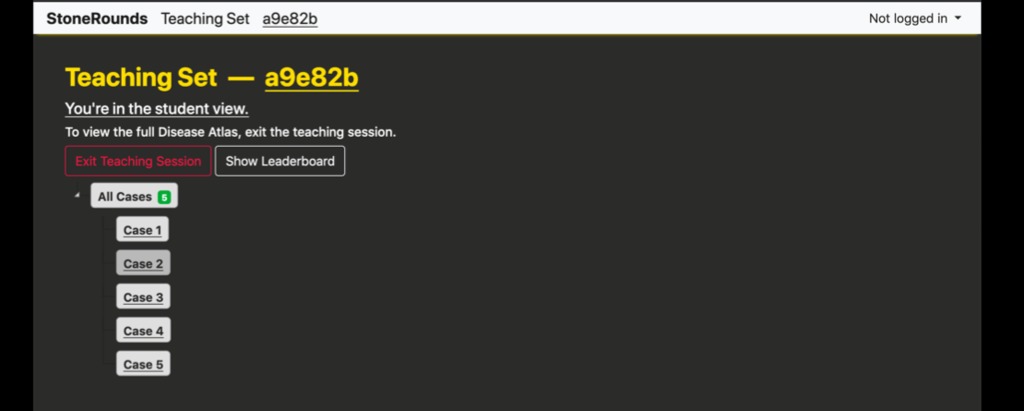
It is useful to note the differences between the presentation of a teaching set in the “student mode” and the “professor mode”, both shown above. In both modes, information regarding the diagnosis and gene have been removed, as has the case identifier (e.g. the SR number), but the “professor mode” has an additional button, “Show Dashboard”.
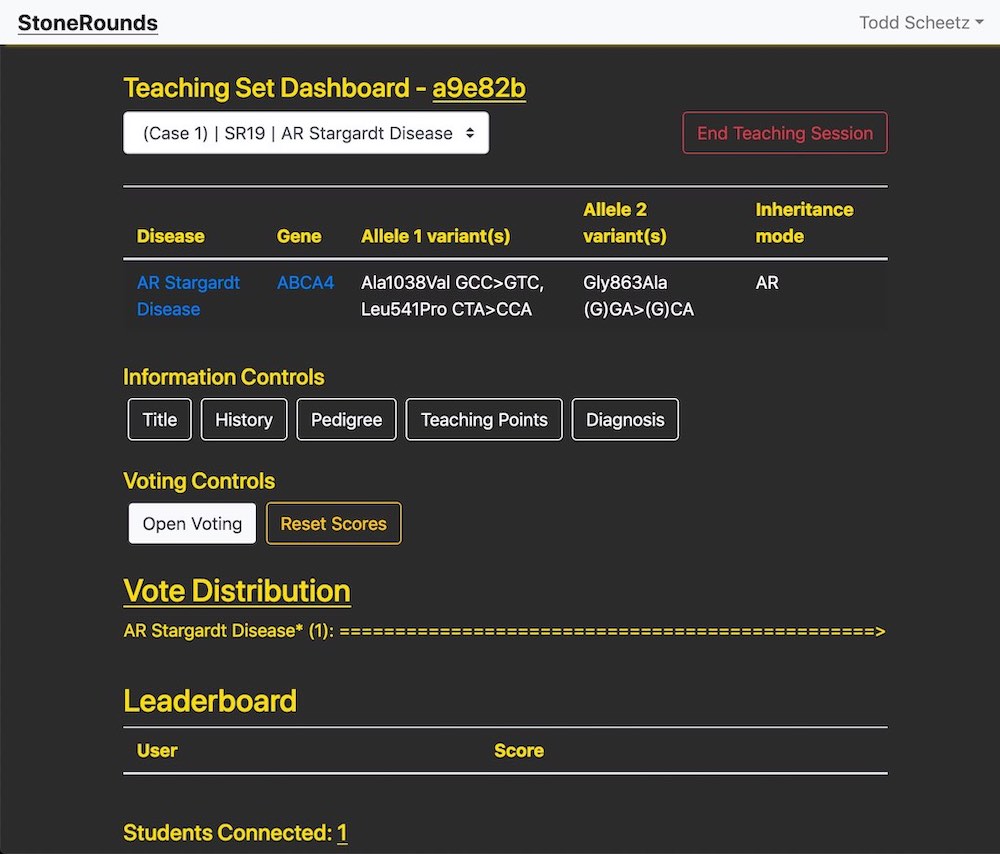
To activate the dashboard’s features, the user should select a teaching set case from the dropdown menu at the top, which will make the molecularly confirmed diagnosis appear. Below are the information controls, which toggle the visibility of the diagnostically relevant information in a case. If a case does not have a particular section—for instance, teaching points—that button will be removed.
The voting controls allow the user to enable voting on the active case and will also reveal the vote distribution box. As participants change the selection in the diagnosis box, this box will populate with a histogram of their selections, sorted by frequency. Until the “Submit Final Diagnosis” button is pressed, the votes will be marked with an asterisk to indicate that they are preliminary diagnoses. The leaderboard will update with users’ scores for correct diagnoses and their usernames, if they choose to reveal them.
Finally, the connection count displays how many users are participating in this teaching session and viewing the active case. When the teaching session is over, clicking “End Teaching Session” will reset all votes, scores, and information controls.
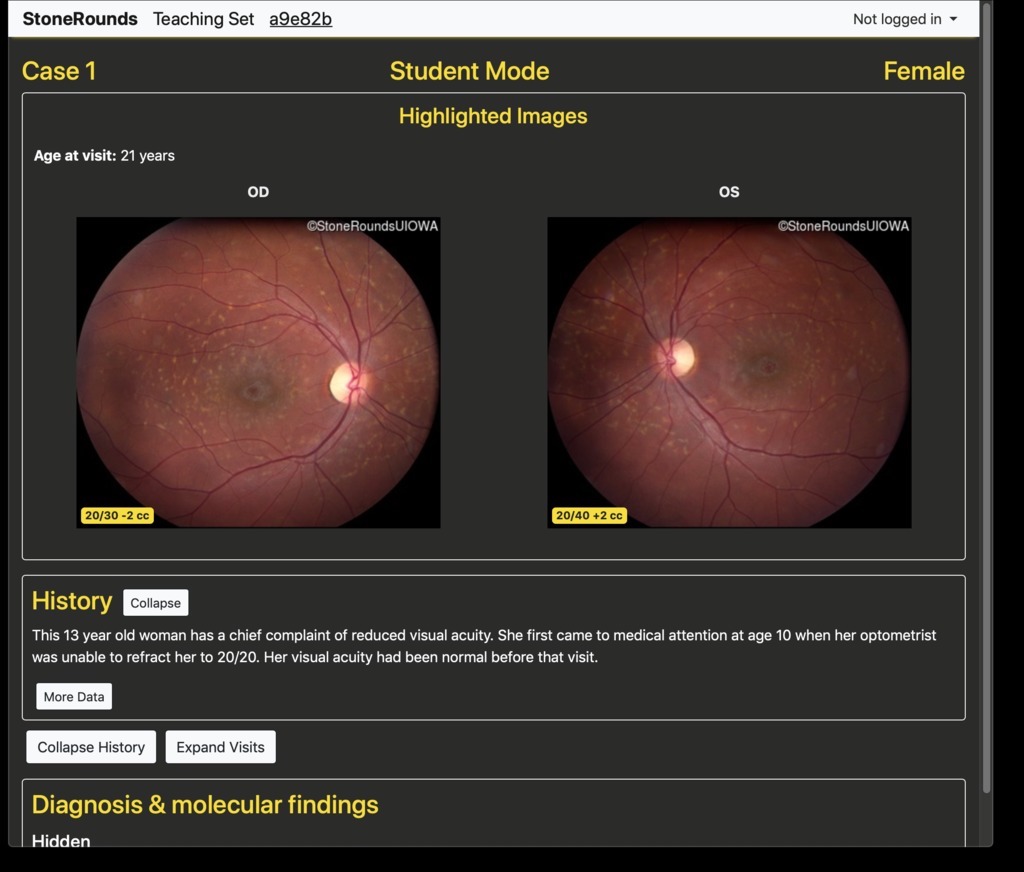
The instructor’s case view is identified by a gold navigation bar at the top of the screen, and the student’s view has a gray navigation bar. Both views are stripped of any case-level identification as well as the diagnosis and molecular findings. As a case is presented, the students can open an abbreviated form of the data available in the Atlas for that case. Specifically, the per-visit imaging data is available, including the visual acuities in both eyes. As is done elsewhere in the site, all images are provided in “clinical orientation” meaning that images of the left eye (OS) are on the right side, and vice versa, as if the student was facing the patient for whom this case represents. By default, only the initial visit is expanded, but the students have the option of exploring the visits, and the variety of imaging data available for each of those visits.
In the dashboard, the information controls allow the instructor to selectively reveal information on an individual case’s clinical history, pedigree structure, the teaching points that are available, and the molecularly confirmed diagnosis. This is powerful information that might sway student’s perception of the diagnosis and/or gene.
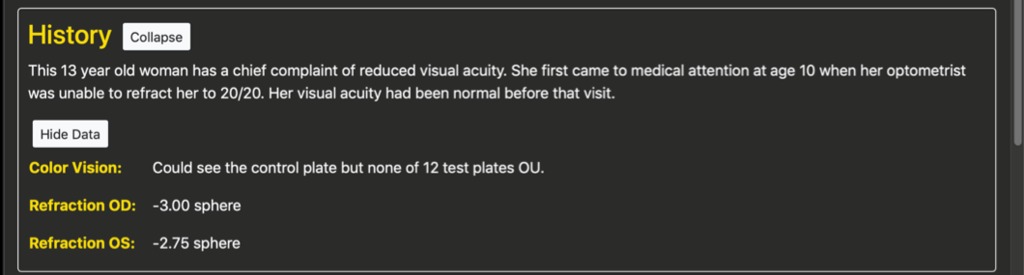
The History section
Clinical history taken during the patient’s visits as well as details about their color vision and visual acuities are given here when available. This provides the student with valuable information about the onset and progression of the disease.
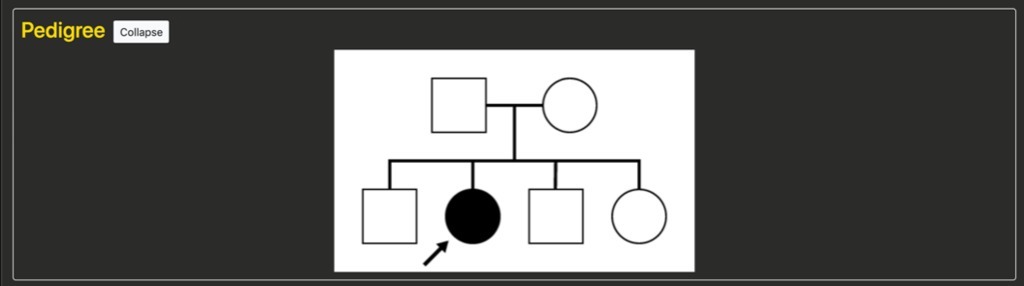
The Pedigree section
It is important to recall that these are “teaching pedigrees” and are not intended to represent an accurate depiction of the specific family structure. But they represent the general inheritance. For example, in this case we have an autosomal disease with two unaffected parents, one affected female child, and several other unaffected children.
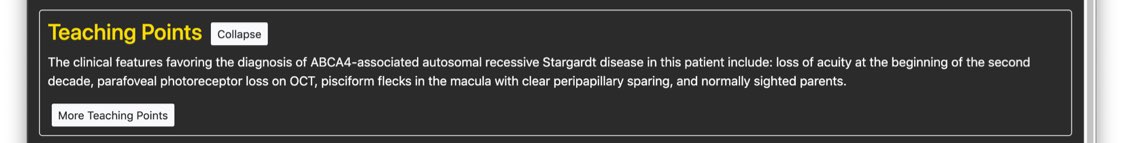
The Teaching Points section
This presents carefully reviewed teaching statements geared towards highlighting how the students may have determined the correct answer based upon the available data. As such, they will sometimes “give away” the answer. They are available for use in Group Teaching mode, but instructors may need to review the text carefully before choosing to reveal them to the students. Often this may be more appropriate after the solution (diagnosis and gene) have been revealed.
Student Participation
The bottom of the instructor’s dashboard shows the number of students participating in the current Group Teaching session. At any time in the presentation of the case, a student can open the diagnosis box (highlighted with the blue arrow in the figure below) and update their preliminary diagnosis simply changing their selection in the diagnosis tree (i.e. an internal node of the diagnostic tree, such as Macular Disease). When the instructor presses the “Open Voting” button in the dashboard, a “Submit Final Diagnosis” button appears in the diagnosis box and students can begin submitting their final diagnoses and, for a chance at a point bonus, the causative gene.
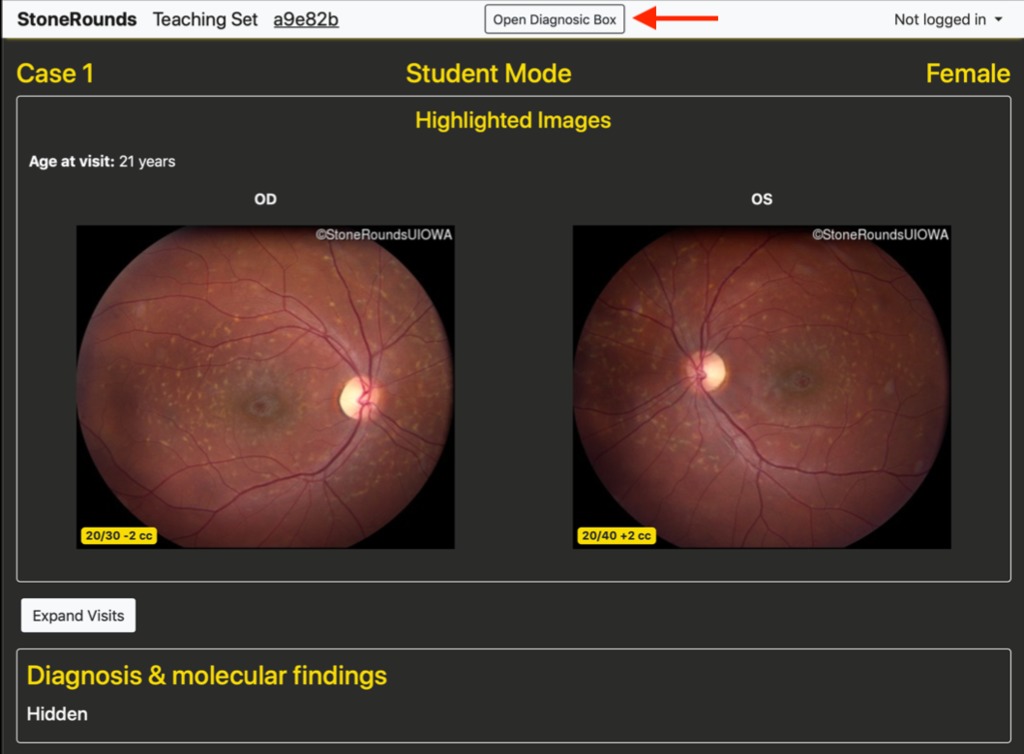
Pressing the “Open Diagnosis Box” button opens a small pop-over window providing a way for students to specify a final or preliminary diagnostic solution. The ability is provided to specify branches of the tree incrementally, or to search for leaf-nodes based upon a text-based search. An example of this pop-over window is shown below.
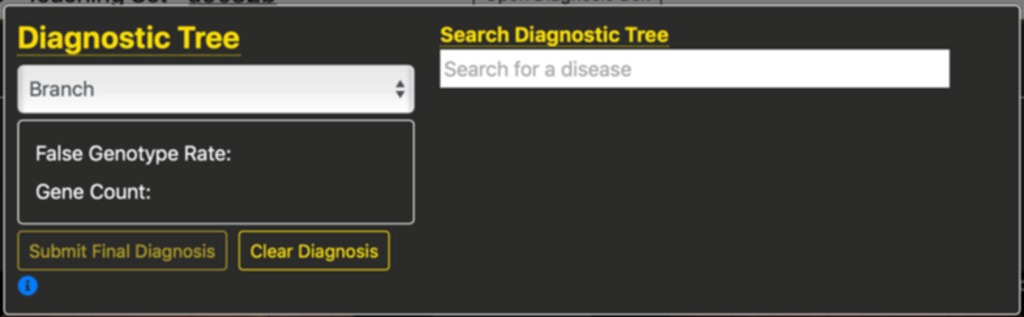
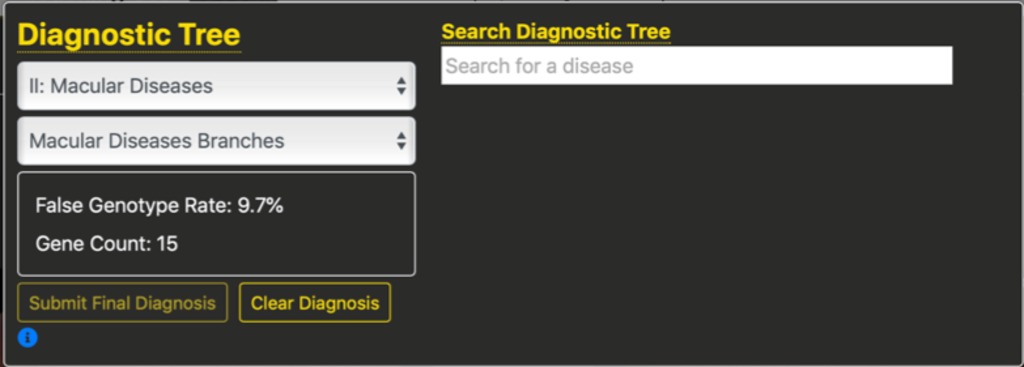
An important feature of this specification is that the number of genes and the False Genotype Rate are updated in real-time as students refine their diagnosis. For example, in the figure below we see that after selecting the second branch, Macular Diseases, the FGR is down to 9.7% and based upon testing 15 genes, even without refining the diagnosis further.
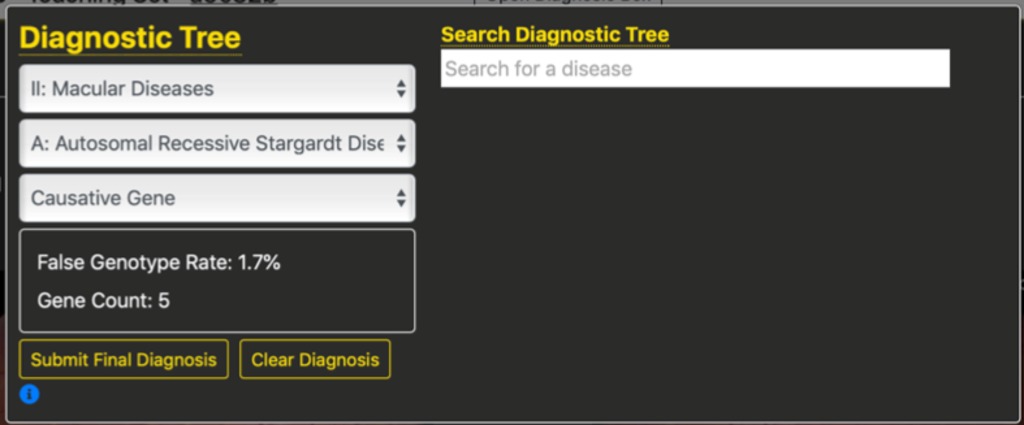
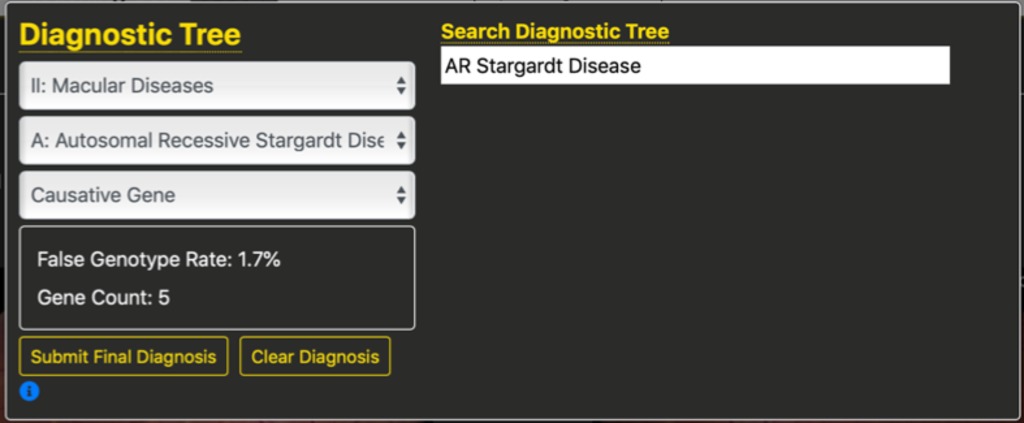
In the figure below we see that specifying an additional branch for autosomal recessive Stargardt disease further reduces the FGR to 1.7% for testing 5 genes.
Finally, we can select the gene that we think is responsible. In this case, we selected ABCA4 which is the most common cause of Stargardt disease.

Alternatively, if we know we want to specify Stargardt disease, we could search for the string “star” which would bring up several options. Selecting one of these options pre-populates the diagnosis tree. This helps to reinforce the structure of the diagnostic tree without requiring students to randomly search the tree. Importantly, these options include synonyms for diseases in the diagnostic tree, with a mapping back to the tree. For example, Doyne’s Honeycomb Dystophy maps to Malatia Leventinese. The figure below shows the first two tree branches filled in, which is sufficient to specify a complete diagnosis of autosomal recessive Stargardt disease. These two tree branches were populated based upon the string search of “star” from which the student selected “AR Stargardt Disease” as their desired diagnosis.
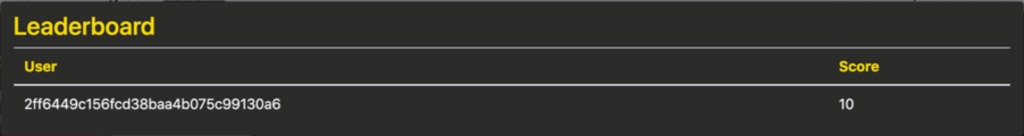
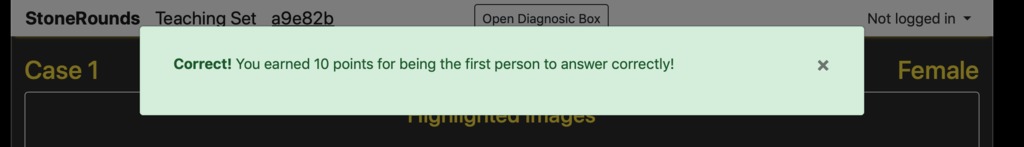
After submitting our final diagnosis, the student is provided feedback on their performance. If they chose correctly, they will see a message in a green box similar to that below and be rewarded based on the order in which they answer. The first, second, and third users to answer correctly receive 10, 7, and 5 points, respectively. All other correct answers receive 4 points. Note that a message is added to the bottom of their window reminding them of their current proposed diagnosis.
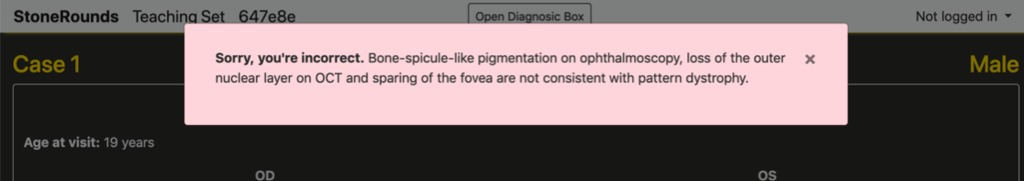
If they provide an incorrect diagnosis, they are shown a red box such as below and receive 0 points. If a more detailed explanation has been written for why a diagnosis on this branch is incorrect for this case, the student will be given constructive feedback tailored to their incorrect answer.
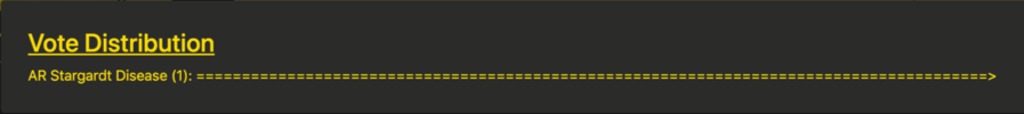
Prior to students submitting their final diagnosis the instructor can see a histogram of the responses (partial and complete) from among the students in the Group Teaching session in the dashboard. Preliminary diagnoses are marked with an asterisk. This allows the instructor to tailor their presentation to quickly address any misconceptions or confounding presentations in real time.
Users can also review the scores across the set of students participating in the Group Teaching session by clicking the “Show Leaderboard” button. These scores are labelled with an anonymous ID or with students’ usernames if they have clicked the “Reveal Username in Leaderboard” button at the bottom of a case. Note that they must be logged in for this button to appear. Additionally, users can choose a more meaningful username for themselves through their “My Account” page.